Javascript - Debug Javascript - Part 2 - Installing Javascript debugger to web browser
|
Eylül 5, 2012 by Javascript Tutorial
|
|
his Javascript tutorial contains and tries to cover following subjects:
- Installing a Javascript debugger for web browser
- Getting familiar with JavaScript debugger interface and tools
Articles tries to provide answer to following questions and issues:
- How to install a Javascript debugger
Articles pre-requisites following information:
- General knowledge of browsers
- General knowledge of browser add-on installation
Explanation of Javascript try catch
In this Javascript Tutorial, we will cover installing Javascript debugger subject which is part of javascript debugging tutorials. In earlier part 1, we had covered basic debugging concepts if you recall. To see that concepts in run-time in a HTML page, we will need to install a Javascript debugger to web browser first. In that tutorial, we will cover installing javascript debugger.
As debugger, we will install Firebug which is a Firefox add-on. Google Chrome and Opera has javascript debugging add-on too. Depending on browser you use, you can install or use their debuggers. General concepts of debugging is similar across the browsers, and applies to all.
By default, Firefox does not come with a Javascript debugger. To install debugger, we download firebug from web site. You can download it from CodeCandle "javascript debuggers" section under "Developer Tools" as well.
After download install add-on to browser. When we restart the browser after installation, there will be 3 option to access debugger.
1. Pressing F12 brings firebug debugger to the bottom of page
2. From Firefox menu, click "Tools". Select "Firebug" from list. Select "Open Firebug".
3. Small bug icon in the lower right corner in the status bar.
When in a HTML page, pressing F12 is a easier method.
Notice that every HTML page that firebug is called addresses that page. For example, if we open firebug in "x.HTML", it means firebug is debugging that page. Firebug has two main panel. Left panel shows source HTML code of page. This is the place where breakpoints are added, and stepping in code. Right panel shows watch, stack and related information. Following image describes interface.
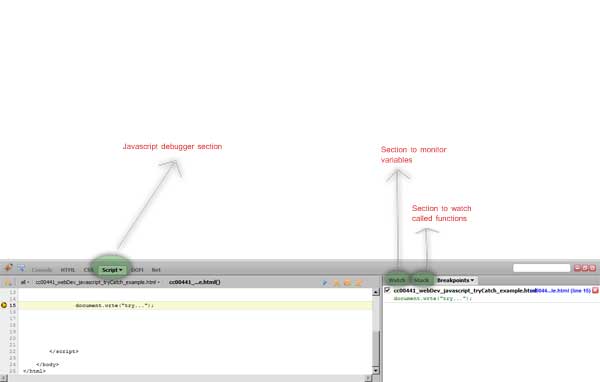
Those are main parts of javascript debugger for firebug. Next tutorial, we will add our error page to debug with that add-on.
Data Layers
| Area: | programming \ languages \ javascript \ \ \ |
| Ref: | |
| Loc: | articles |
| Tags: | javascript |
|