Javascript - Debug Javascript - Part 3 - Debugging javascript with stepping
|
Ekim 5, 2012 by Javascript Tutorial
|
|
his Javascript tutorial contains and tries to cover following subjects:
- Using a Javascript debugger in web browser to monitor code
- Using javascript debugger stepping: STEP INTO, STEP OVER and STEP OUT.
Articles tries to provide answer to following questions and issues:
- How to debug javascript
Articles pre-requisites following information:
- General knowledge of browsers
- General knowledge of Firebug
- General knowledge of Debugging concepts and stepping
Debug Javascript
In this Javascript Tutorial, we will cover aJavascript debugging subject which is part of javascript debugging tutorials. In earlier part 1, we had covered basic debugging concepts if you recall. In part 2, we installed javascript debugger. In this part 3, we will use javascript debugger add-on, will load a HTML page which contains javascript error and debug it to understand how to debug javascript codes.
Following Javascript is a loop to iterate - loop through 5 times and write the number of cycle to the html page. Each iteration triggers a function in same script block above the loop. Function gets sum of iteration number. If cycle is 2, sum becomes 4. We place breakpoint before loop. Lets see the image:
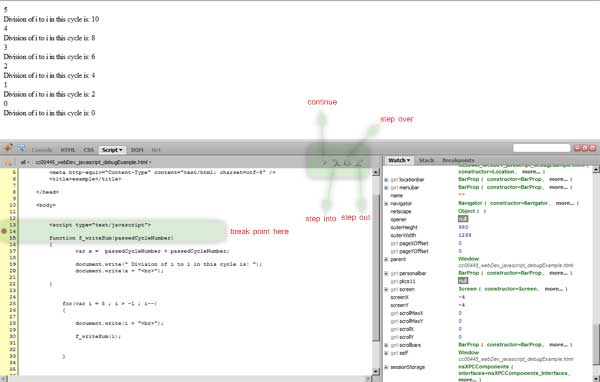
In javascript debugger screen, two green areas, left area shows breakpoint. Breakpoint means we told javascript to resume execution of javascript when page is being load. When page is loaded, javascript debugger will resume here. To add that breakpoint, we double click to the line number of code we want to place breakpoint to pause execution. Right top green area indicates steppings. When a breakpoint is placed, and page is loaded, they will become active.
If you click continue, execution of javascript fill be done.
Step into will execute next line. If next line is function, execution goes to first line of function and pauses. If you keep clicking step into in javascript function, it executes each line in function while you are in function. Idea behind here is to go any place where code calls. In our example, it will go to first line of function above which prints sum of cycle numbers.
Step over executes next line. If next line is function, it will not go to function above. It will execute function as a line. Function was around 4-5 line above. Idea here is, it executes line as package if it is function. Step over is used when debugging in cases that we do not want to go into function. Therefore, function is executed as a line if u click step over. And execution goes to next loop in our example.
Step out executes next line. It executes all lines of function which you are inside it if you in any line where you are. And returns to the function which called it. If you click it in our example in function above, it returns you to the javascript loop at bottom.
Step into and step into both executes a line of javascript code if it is a normal code line (not function). Step over, however, skips going into function if it is clicked.
To understand better that javascript debugger behaviors, lets see three of them with example images.
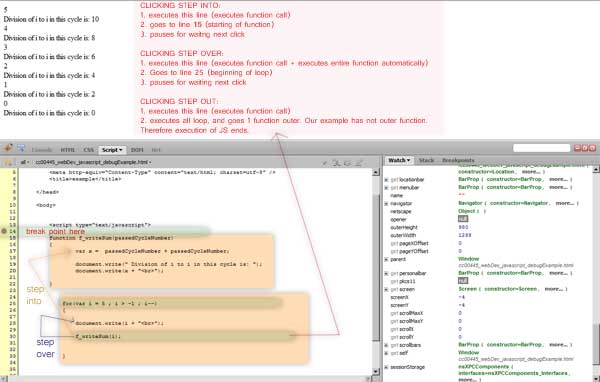
We loaded HTML page, and put "breakpoint" 1 line before the "for loop". Javascript above will cycle 5 times. It will call "f_writeSum" javascript function above it 5 times. Function there prints sum 5 times, each print is 1 times for each loop cycle call.
Data Layers
| Area: | programming \ languages \ javascript \ \ \ |
| Ref: | |
| Loc: | articles |
| Tags: | javascript |
|